Census Reveals Vacant Housing Mysteries
Never before seen data released for major cities which shows what was hiding under that mysterious "Other" vacant housing category.

The recently released American Community Survey 2021 population and housing estimates help reveal once murky details about vacant housing. Previously, the “Other” category of vacant homes only described specific causes and lengths of vacancy for large metropolitan areas, which only began in 2012. New ACS data includes all cities, which is likely due to the intense focus on vacant housing in political discourse in the last 10 years.
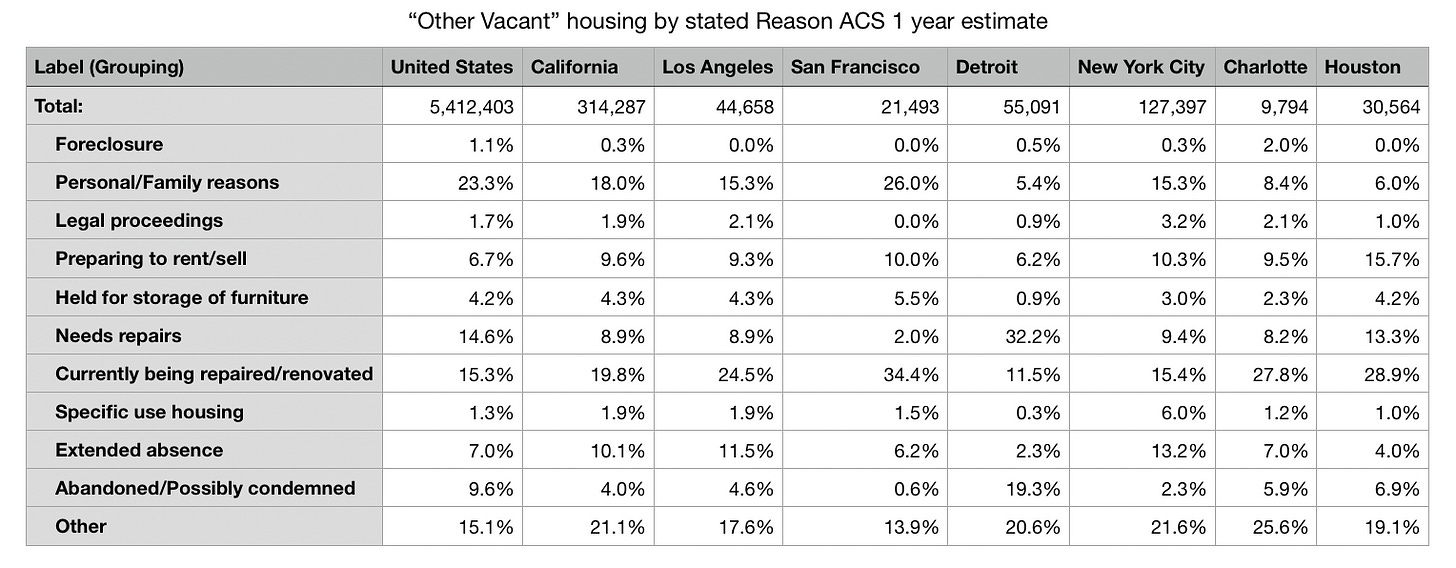
This table contrasts a sample of cities, including Detroit, a disinvested city; Charlotte, a housing elastic city; and Houston, a housing boom city, along with the standard unaffordable cities of San Francisco, LA and NYC. Seattle, though expensive, is also included for its relative building boom compared to other coastal cities.
Patterns are somewhat clear — cities with housing booms heavily gravitated towards shorter vacancy lengths of ~1–4 months. Cities with no housing boom and little demand gravitate to long-term vacancies beyond a year, like Detroit.
A city with decent housing availability should have a heavy amount of vacancies in months 1-6, the usual occupant-to-occupant vacancies. In cities with larger amounts of new housing construction, numbers of vacancies under a month skew higher. You can see the data polarization at the short and long term vacancy durations with the national level data where vacancies over two years represent shrinking areas and vacancies less than one month represent rapidly growing areas.
For my Bay Area readers, San Francisco and Oakland’s vacancy duration data merely reaffirm the reality of a housing shortage. If more housing were available, far more vacant housing would be in the 0–6 month timeframe. However, vacancies exceeding 6 months and especially 2 years are concerning. Beyond popular theories that these homes are vacant due to rent control dodging landlords, derelict and uninhabitable conditions, or real estate speculators laundering money, more realistic possibilities include the common duplex or backyard granny unit simply out of use by the current occupants.
Of the six categories of vacant housing: for rent, rented but not occupied, for sale, sold but not occupied, seasonal and vacation housing, migrant housing and the lackluster “other”, the census now offers 11 more categories:
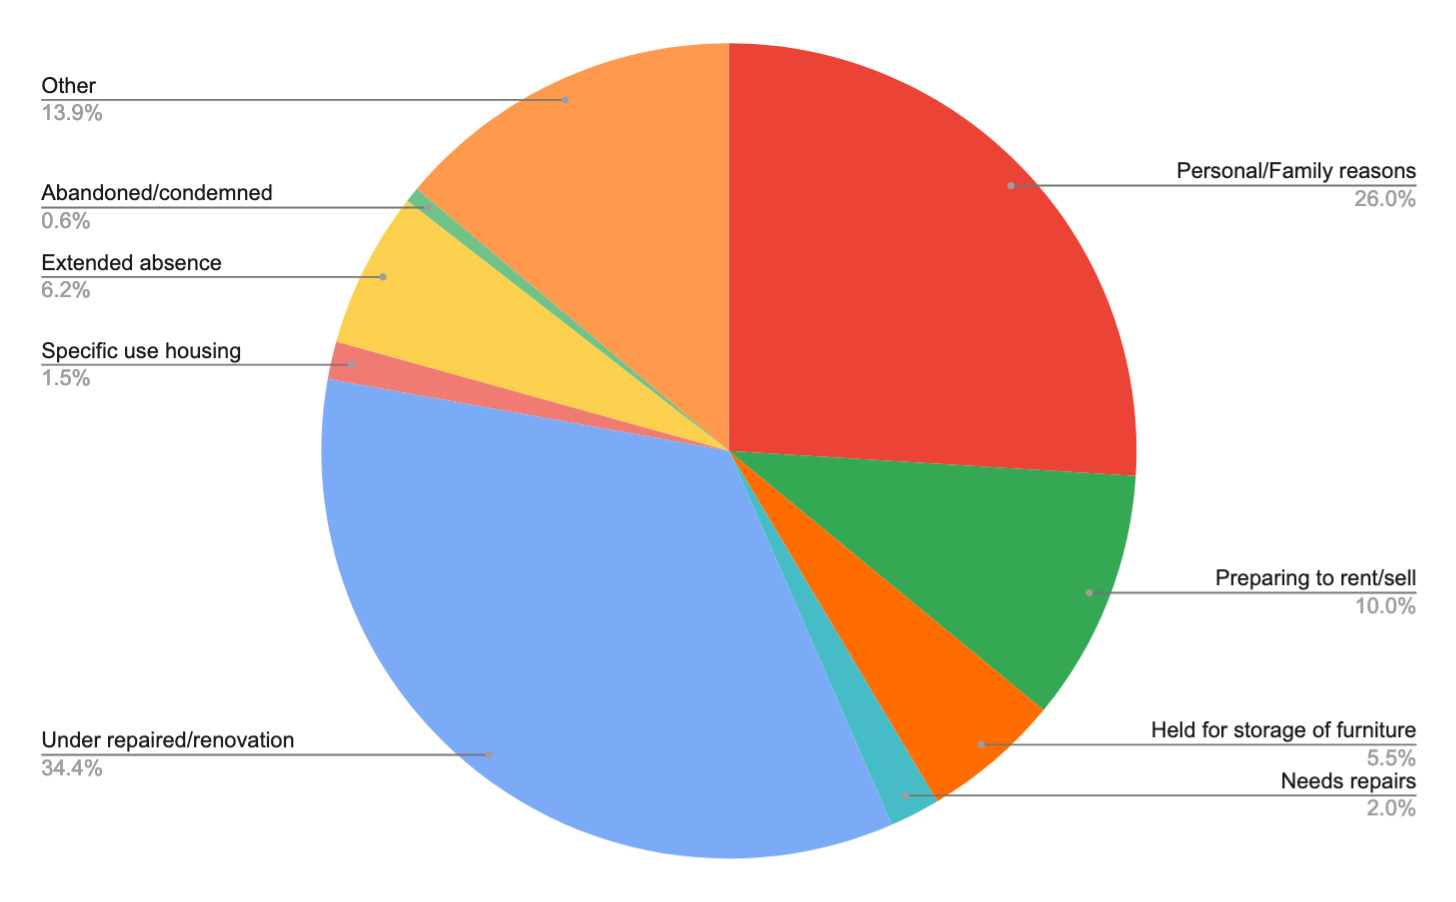
The data reveals that San Francisco’s “other” vacancies are not a problem of derelict housing. Only 2% of this category needs repairs and only 0.6% is condemned. Most uninhabitable vacant housing has owners who can finance repairs, which is why the highest rate of “other vacant” housing in San Francisco is the “under renovation” category, which is uniquely high among places in the table. San Francisco also has the highest share of vacant housing reserved for personal or family reasons, accounting for one-third of the “other vacant” category. The Census provided description of the vacancy categories includes reasons such as the owner is in assisted living, the owner doesn’t want to use the unit or the owner is just indecisive.
If a property owner were holding housing units vacant for speculative reasons and it wasn’t classified as Seasonal Vacancies (which secondary and vacation homes almost always are), then Personal/Family Reasons is the likely category. If we look at the 2015-2019 ACS average of “Other” vacancies by geography, the concentration of “Other” vacancies are mostly in the city’s northern neighborhoods, the Western Addition, and a few spots around Portero and Bayview. The new high rise homes south of Market Street which are now symbols of speculative vacancies by anti-vacancy advocates instead host mostly Seasonal & Vacation vacancies and very few “Other” vacancies.
ACS data suggests San Francisco’s proposed vacancy tax will largely hit older multifamily housing in northern districts. In total thats roughly 5,588 units although certainly less than that due to the duplex and single-family exemption. Looking around S.F. and the Bay Area, “Other vacant” housing seems mostly concentrated in inelastic districts with older multifamily housing.
My best guess is that “Personal/Family Reasons” categories are residents of former multifamily housing unofficially categorized as single-family or low-density condos, inherited properties with inattentive or indecisive owners, rent control avoidance and elderly owners uninterested in renting out their properties. It’s also probable that the slow permitting process in San Francisco is prolonging the renovation and repairs of housing. As usual, this release opens more questions than it resolves. It seems unlikely anyone will be satisfied about the use of vacant housing until the Census Bureau explicitly asks: “are you holding your units for speculative purposes?”
Lastly, it’s important to remember that this ACS was conducted in 2021. The pandemic was still in its peak, remote work was in full swing, vaccines were rolling out and the year closed out with the Omicron variant unleashed. The overall estimated increase in vacant housing shown by the 2021 ACS data in San Francisco and elsewhere is certainly a blip in time that is probably no longer representative.


It would be useful to see the second table, but including the other five categories.
By my calculation, ~5000 homes in San Francisco are in the Personal/Family category. That's not very many, and presumably some of them are vacant because, as noted, the elderly owner is in some kind of elder care or the unit is a duplex or ADU used as part of the main house. So... that's not very many homes that could be being held by speculators, even if we count rent control dodgers as speculators.